
Project Description
Battle Live Digital Mapping vs Sketchnote
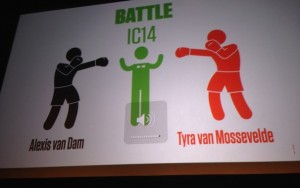 LiveMindMapper Alexis van Dam went head to head with Tyra van Mossevelde. The battle consisted of 3 rounds (talks/ presentations), in which
Tyra and Alexis both took notes their own way. Tyra used Adobe Ideaz on her iPad and sketched the contents in drawings. Alexis used 4 different mindmap software tools and tested these n the fly to find out which software is best to make live mindmaps. After each round they both showed their visualisation of a predetermined talk to the audience. The audience could decide which form of visualisation (sketch or mindmap) was best.
Line-up of speakers Infographics Conference 2014
1 Nicholas Felton
 Topic: The Feltron reports.
Nicolas Feltron, known for the Feltron Reports, opened the conference. These are personalized annual reports of his whereabouts, his actions, what he eats and drinks, etc. The reports were picked up by the New York Times and Wall Street Journal. In his keynote, he also spoke about his own app, that people can use to make a log of their own lives.
Mind Maps: MindManager file, MindMeister, PDF
2 Professor John Grimway
 Topic: The Personal Data Nightmare
What is not suitable for an infographic and what is!
Mind Maps:
3 Yael de Haen
 Topic: Every Picture Tells a Story.
Yael de Haan spoke about the extent to which Every Picture Tells a Story and the process of creating an infographic.
Mind Maps:
MindManager file, MindMeister & PDF
4 Stefanie Posavec
 Topic: Attached to data
Stafanie shared beautiful data visualizations of the longest sentence and activities of people on Facebook
Mind Maps:
5 Thijs Niks
 Topic: CASE 1: RTL Nieuws facts.
Address the current state of newspapers and their evolution
Mind Maps:
NovaMind,
6 Renato Valdes
 Topic: CASE 2: Human-App: the qualified self, a personal story
Showed how 30 minutes of movement can make a big impact on people.
Mind Maps:
7 Jelle Kamsma
 Topic: CASE 3: LocalFocus
Talked about the possibilities of standardized visualizations of data which are used by news sites and local papers.
Mind Maps:
8 Moritz Stefaner
 Topic: Selfiecity.
Demonstration of a data visualization project selfiecity
Mind Maps:
NovaMind,
9 Geert Rozinga & Frederik Ruys
 Topic: outtake Nederland van boven.
Closing keynote on data journalism showed visualization of the Dutch TV programme ‘Nederland van Boven’.
Mind Maps:
MindManager file, MindMeister & PDF
Interested in the possibilities of Live Digital Mapping?
If you are an owner of an event and/ or an organiseren please check out how Connection of Minds can help you to get more interaction at your event and also better capturing of valuable ideas, knowledge and insights. Please contact us.
Please contact us
Project Details
- Client Infographics Conference
- Date 14 maart 2014
- Tags Events en congressen, International, Keynote Mapping
Project Description
Battle Live Digital Mapping vs Sketchnote
LiveMindMapper Alexis van Dam went head to head with Tyra van Mossevelde. The battle consisted of 3 rounds (talks/ presentations), in which
Tyra and Alexis both took notes their own way. Tyra used Adobe Ideaz on her iPad and sketched the contents in drawings. Alexis used 4 different mindmap software tools and tested these n the fly to find out which software is best to make live mindmaps. After each round they both showed their visualisation of a predetermined talk to the audience. The audience could decide which form of visualisation (sketch or mindmap) was best.
Line-up of speakers Infographics Conference 2014
1 Nicholas Felton
Topic: The Feltron reports.
Nicolas Feltron, known for the Feltron Reports, opened the conference. These are personalized annual reports of his whereabouts, his actions, what he eats and drinks, etc. The reports were picked up by the New York Times and Wall Street Journal. In his keynote, he also spoke about his own app, that people can use to make a log of their own lives.
Mind Maps: MindManager file, MindMeister, PDF
2 Professor John Grimway
Topic: The Personal Data Nightmare
What is not suitable for an infographic and what is!
Mind Maps:
3 Yael de Haen
Topic: Every Picture Tells a Story.
Yael de Haan spoke about the extent to which Every Picture Tells a Story and the process of creating an infographic.
Mind Maps:
MindManager file, MindMeister & PDF
4 Stefanie Posavec
Topic: Attached to data
Stafanie shared beautiful data visualizations of the longest sentence and activities of people on Facebook
Mind Maps:
5 Thijs Niks
Topic: CASE 1: RTL Nieuws facts.
Address the current state of newspapers and their evolution
Mind Maps:
NovaMind,
6 Renato Valdes
Topic: CASE 2: Human-App: the qualified self, a personal story
Showed how 30 minutes of movement can make a big impact on people.
Mind Maps:
7 Jelle Kamsma
Topic: CASE 3: LocalFocus
Talked about the possibilities of standardized visualizations of data which are used by news sites and local papers.
Mind Maps:
8 Moritz Stefaner
Topic: Selfiecity.
Demonstration of a data visualization project selfiecity
Mind Maps:
NovaMind,
9 Geert Rozinga & Frederik Ruys
Topic: outtake Nederland van boven.
Closing keynote on data journalism showed visualization of the Dutch TV programme ‘Nederland van Boven’.
Mind Maps:
MindManager file, MindMeister & PDF
Interested in the possibilities of Live Digital Mapping?
If you are an owner of an event and/ or an organiseren please check out how Connection of Minds can help you to get more interaction at your event and also better capturing of valuable ideas, knowledge and insights. Please contact us.
Please contact us
Project Details
- Client Infographics Conference
- Date
- Tags Events en congressen, International, Keynote Mapping
Comments are closed.
Comments are closed.